

Grassroots grant: Geoanimations
“Grassroots Project: Geoanimations, a powerful interactive didactic online tool for Physical Geography”
Physical geographer Gotze van Kalsbeek (pictured left), affiliated with the Geography teacher training program (UvA), has developed geoanimations. He did so with input from colleagues and cartographer Anton van Tetering, supported by a Grassroots grant. Geoanimations are online interactive geographic maps or models. They are now used in the working classes on teaching geography to support prospective geography teachers in teaching their subject.
Interactieve geografische kaarten ter vervanging van filmpjes
“Until last year, in Vakdidactiek Aardrijkskunde we often used animations and movies from the United States, which used the software programs Flash and Shockwave. Those programs are now completely out of print, as they are no longer usable over the Internet due to insecurity. 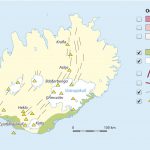 As a result, these videos are no longer an option to work with in lectures. We missed these animations and I started to think about interactive geographical maps. During a conversation with cartographer Anton van Tetering, whom I had asked to design a map of Iceland in connection with the volcanic eruption there, I mentioned my idea of making maps interactive.
Anton indicated that he could build something like that. He then shaped my ideas into an interactive example map of Iceland, which really appealed to me. Because he is also a geographer, he also came up with subject-specific input. So when I got this Grassroots grant to develop this concept further we continued to work together.”
A powerful didactic tool available to everyone online
“You can show a video from beginning to end and pause in between to add your story, but the beauty of these Geoanimations is that you can click parts on and off on the interactive map during your story. So you don’t have to pause. Geoanimations are a powerful didactic tool for showing and explaining things. You can show as much or as little information in the map as you need at that moment to explain and adapt to the level of your audience.
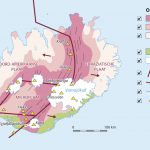
So if, for example, you want to explain the volcanic eruption in Iceland, you can build up your explanation by clicking on the components step by step: the fault lines, the direction of movement of the plates, fissures, the volcanoes themselves, ice caps and glaciers, the age of the rocks. These Geo animations are very useful to get to the core of your teaching and to make essential choices for the construction of your story: how do I explain it, in what order, which terms do I click on and off, depending on the level of the audience.
You can easily adapt your story to bridge classes, 6 VWO or other audiences by, for example, omitting or including complicated terminology. We use the tool in the geography teacher training program here at the university. In addition, I am also promoting this tool among geography teachers in the country so that they too can use it in their classes in secondary schools. It is a huge plus that the geo animations are online so anyone can always access them for free and “play” with them again later. Not only teachers, but also students and high school students.”
The work process was extremely fast
“Grassroots gives you a year to develop your project, but we went so fast that within 6 months we have already built 8 geoanimations and there are already ideas for new geoanimations. And that in the corona year: the whole project was created without meeting in persona through email, zoom and calls. The whole process by geoanimations took about 3 weeks on average. I asked for input from my 2 UvA colleagues for this project during the research period, but also from colleagues from all over the country and from Belgium. Some of them liked the idea so much that they started building it themselves. I submitted a kind of script to the cartographer for the construction of each geoanimation, then he gave his comments and started building. He understood very well what we wanted and built at lightning speed. In no time we had geoanimations of plate tectonics, climate zones and wind systems, geological origin of NL, demographic transition Netherlands, the urban development of Amsterdam, an interactive map of Iceland. I also asked for feedback from colleagues on the final product and we tweaked it several times afterwards. I share the tool on twitter and receive responses which we then use to make improvements. I wanted to bundle all geoanimations in one place so that you can click on what you’re looking for, just like on a Zalando website for example. I have made some sort of collection website, https://lesmateriaal.geobronnen.com/index.php/interactieve-geoanimaties/, in which you can find our but also others geoanimiations. I think it’s important for anyone to be able to use it for free.”
Responses and future
“We noticed in the subject teaching meeting that the students from the teacher training program find this tool very useful for their explanations. You can work with it in different didactic ways and we are going to apply that in the coming period. It is so easy to use, nice and clickable, you can choose how busy you make the map by clicking on something or not, the cartography is very clear.
 It has been distributed to geography teachers all over the country, but I will also present the geoanimations on the LIO day with geography teachers. We will then work with it in small workshops. In May, I will speak at an international conference on geoanimations and at the national education conference of the Geography Professional Association. Geoanimations also turn out to be a handy tool when education has to be given online, which happened to be the case during the pandemic. We are working on translations, so that we can offer at least a few geoanimations in English. Perhaps in the future we can also use them for digital worksheets. I have built in statistics on the website and I see that the tool is already being used and that is very nice to see. I am doing my best to bring the geoanimations to the attention and hope that more and more use will be made of them.”
Geoanimations
- Plate tectonics
- Iceland
- Hydrograph
- ITCZ
- Ice ages in the Netherlands
- Amsterdam
- Demografic transition model
- European collaboration
- Gotze Kalsbeek
- Didactics geography Amsterdam
- Studio Haverstraat
Click here for another completed Grassroots project from the Geography subject teaching group
Series of examples of online education during COVID-19 in practice
This story is part of a series of inspiring case studies of online education during the COVID-19 pandemic, which emerged during focus group discussions within the research project ‘Online and blended education at the UvA’. This research project offers insight into the experiences of lecturers and students with online (aspects of) education and the strategies lecturers have used to stimulate (online) learning. The stories and reports from this project can be found on the project page