







From “I Hate Statistics” to “Can I Try Again?”
In this best practice, Tom Meijer (CoLs) shares how he reshaped a first‑year Statistics and Maths course together with his colleague Michiel van Wijk (IBED). Their goal was to strengthen student ownership and connect statistical theory to real data through weekly formative tests and mini‑projects.
Course: Basiswiskunde en Statistiek in de BMW (Basic Maths and Statistics in Biomedical Sciences), Biomedical Sciences
Students: 1st‑year BSc, ~150 students, ~20 per tutorial group
Active learning design: Weekly tests and real-life data mini‑projects

Tom Meijer
Tom and Michiel built the course around two recurring elements: Weekly pass/fail tests and weekly real-life data mini-projects.
- Weekly tests: Every week, students take an online formative test via the Sowiso platform. Students can retake the tests multiple times to practice and monitor their understanding. It’s not part of the final grade, but they do need to score at least 70% to ‘pass’. You can find more information about this teaching activity in the STEM active learning activity finder.
- Real-life data mini‑projects: In small groups, students work on short projects (finished within one tutorial) where they apply the method they just learned to real-life biomedical data or data they collected themselves. Each group creates a poster explaining their research question, methods and outcomes and present it during the tutorial. You can find more information about this teaching activity in the STEM active learning activity finder.
Tom explains their choice for this setup: “We noticed a lack of ownership and motivation in our students to dive into the highly theoretical content. We wanted to give them a clear link between the theory and how to apply it to real data. Also, we wanted to give students insight into their learning process.”
Since the introduction of unlimited formative testing, about 10% more students now pass the course. Tom noticed how students who’ve already scored over 70% (and thus a pass) for their weekly test often keep going for the full 100%. “They can get really fanatic! And I am also proud to see that some of our students make really nice posters and are able to explain their methods really well.”
Student experience and lessons learned: Data, workload and structure
Students now do more work in the same time than before, but their responses are positive. “That is a nice surprise!”, says Tom. “I feared some negative responses because the weekly tests were added without removing other course components, but students seem to appreciate the opportunity to practice key concepts.”
The mini‑projects and posters are also well received. Students prefer working towards a clear product over doing standard exercises, even though the two‑hour tutorial format creates some time pressure.
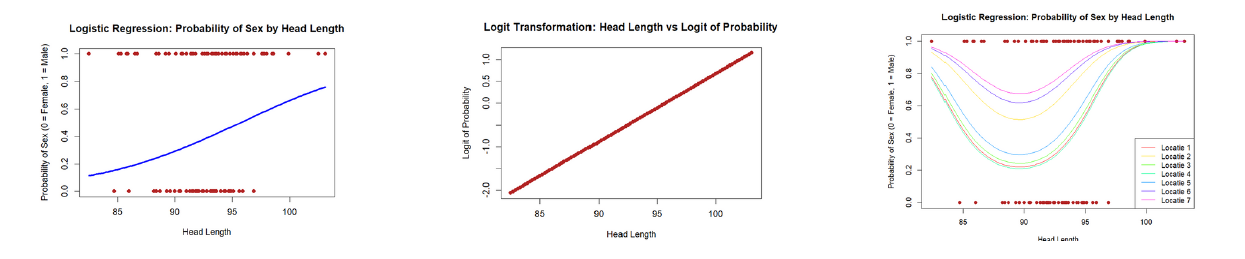
Example of student work
Designing the projects highlighted one practical challenge: Finding “easy‑to‑use” data that fits the level and type of analyses students need to perform. To address this, Tom and Michiel are moving towards using data that students generate themselves during practicals, so that the statistics work connects directly to other course activities.
They also learned that clear structure can compensate for higher workload. Students now complete more tests and projects, but the course has a predictable weekly rhythm, and all activities are aligned with the core learning goals. This gives students a clear sense of where they are and how well they understand the material.“I think this insight in their learning progress outweighs the extra effort they have to do. Students profit a lot in our course by practicing more.” concludes Tom
Advice for colleagues: Designing for ownership
 For colleagues considering similar changes, Tom’s main advice is to focus on alignment and transparency: Create a clear structure and make sure that formative tests, projects and other activities all point in the same direction. The focus on student ownership guided Toms’ and Michiels’ choices.
When the course is well aligned, you can make it more challenging without losing student motivation, because students see how each element contributes to their learning and progress. Other lecturers can apply this by designing activities where students actively work with authentic data, make meaningful choices, and receive regular formative feedback.
Get in touch and try it yourself
Tom is happy to hear from colleagues who are interested in their design with formative testing, mini‑projects with real data, or student ownership in statistics. You can reach out to Tom via t.t.meijer@uva.nl.
You can also find this workflow in the activity finder: In Real Life statistics and Weekly test.